


The US, Canada and Mexico are about to host the FIFA World Cup, the biggest international football tournament on the planet. Ahead of the first games this week, we asked: which World Cup qualifier has the best pension system?
To get as definitive an answer as possible, Nick Reeve and Tom Parker, co-hosts of the Always A Pensions Angle podcast, collated data from a variety of sources to get a picture of what each country’s retirement system looks like. Along with LAPF Investments editor Brian Gielty, they have painstakingly analysed this data and created an epic knock-out tournament.
Can England triumph 60 years after their memorable win against West Germany? Will Brazil samba their way to a comfortable retirement? And can France – favourites for the football tournament – do their pensioners proud?

The World Cup of Pensions: How it works
For simplicity, we have limited our competition to 32 teams on a knock-out basis. Countries with football teams that have qualified for the 2026 World Cup are eligible, and seeded according to US News’ Comfortable Retirement Index.
Each head-to-head is decided using eight factors:
- A country’s score on the Mercer CFA Institute Global Pension Index, which assesses national pension systems on a range of factors grouped under ‘adequacy’, ‘sustainability’, and ‘integrity’ headings. In the event of a tie, the higher score on this scale will be deemed the winner ‘on penalties’.
- US News Comfortable Retirement Index, which ranks countries based on a number of factors, including healthcare, happiness, taxation, and public transport.
- Life expectancy and GDP per capita are both commonly used indicators of health and wealth. Data is sourced from the OECD, the World Bank and the United Nations.
- Replacement rate, or how much of a person’s working income is replicated through their retirement income. This was sourced from the International Social Security Association’s (ISSA) database.
- Total assets in a country’s pension system, as per OECD data.
- Cost of living, based on Numbeo’s international cost of living index tool. Countries are scored based on how expensive they are compared to New York City.
- Minimum monthly state pension. Based on a variety of sources, but primarily the ISSA’s database.
State pensions - an important caveat
In estimating each country’s minimum state pension, we have used a variety of sources, but also relied on our own calculations, especially when pensions are calculated based on a percentage of the minimum wage, for example.
In some countries, state support in retirement does not have a floor or is based on a variety of factors depending on an individual’s circumstances, so we have made educated guesses as to how much a typical worker could expect to receive. Please do not attempt to retire based on our results!
Listen to this week’s double episode of Always A Pensions Angle for a full rundown of the draw and how we arrived at the results. You can expand the tabs below to find out more about the quarter-final ties onwards, and our unique World Cup of Pensions wallchart is also available to peruse.

As the World Cup of Pensions’ top seeds, Switzerland is expected to do well. With a GDP per capita of more than $100,000 and a large funded pension system, it’s no great surprise to see the Swiss system outscore Sweden. Despite the strength of the Swedish state pension, backed by the highly regarded AP funds, it’s Switzerland that progresses in our first quarter-final.

For years, Australia has been held up as the system the UK should seek to emulate. In this match-up with Mexico, we see just why. While Mexico can boast an enviable net replacement rate of 132%, Australia’s higher state pension, high level of pension assets, and longer life expectancy all help the Aussies make the semi-final.

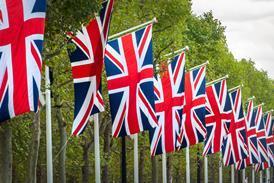
The British and Dutch pension systems are often compared as similar, given their long histories of defined benefit (DB) coverage. But in this quarter-final, there is no match. England (or rather, the UK) may have more pension assets, but it’s what you do with them that counts. The Netherlands boasts a higher replacement rate, a much higher state pension, a better rating from the Mercer CFA Institute Global Pension Index, and it’s a cheaper place to live. Another ignominious quarter-final exit for England.

Sacré bleu! Canada’s much-admired Maple Eight have helped the Canucks to victory over France. It’s a close call, but higher GDP per capita and a huge pile of pension assets mean Canada progresses, despite France’s superior state pension and replacement rate.

The wealth of Switzerland takes on the mighty Australian auto-enrolment system. And to prove that money isn’t everything, the Aussies have edged this one with a higher Mercer CFA Institute Global Pension Index score, more pension assets, and a better cost of living.

Two systems built on strong DB coverage and scaled-up institutional investors go head-to-head. The Maple Eight might be the model of choice for the UK’s institutional investors, but it’s not quite enough. Canada boasts a better life expectancy (just), more pension assets and a lower cost of living, but the Dutch replacement rate, state pension, and overall Mercer/CFA score see the Oranje make it to the final.

Which is better, a pure DC system built on compulsory auto-enrolment, or one with its roots in DB but in transition to a DC-style future? It’s almost too close to call…
Australia has the edge on pension assets, with more than $2trn according to the OECD, compared to the Netherlands’ $1.8trn. The Aussies can boast a longer life expectancy and a lower cost of living, too.
But the Netherlands fights back with a strong replacement rate of 97%, a generous state pension (equivalent to more than £1,800 a month), and a higher GDP per capita.
Ultimately, it’s come down once again to how each country rated on the Mercer CFA Institute Global Pension Index – which means the Dutch take the crown, with a rating of 85.4 to 77.6.

Subscribe for free to the Always A Pensions Angle podcast via Spotify, Acast, or wherever you get your podcasts.