


Data crunch: ClearGlass’s Chris Sier shows that the best active funds are usually run by the lowest-cost managers, and asks whether fund houses’ readiness to provide data can be shown to be a sign of good net performance.
I have previously stated that not all managers are equally willing or able to give data, and some are better in both attitude and application than others.
I even named the managers that have, over the past 18 months, been the best at meeting the requests that we make at ClearGlass on behalf of asset owner clients.
Scoring well with data requests might be considered one measure of ‘value’ in the value-for-money equation. Performance might be considered another measure of value, and cost data is the only measure of ‘money’.
Based on these criteria, the difference between good value-for-money managers (best performance at lowest cost) and worst managers (worst performance at highest cost) is identifiable and striking.
One way to figure out good from bad is to use benchmarking, for which you need a big and comparable dataset. To do so I need to start by first looking at active and passive equity funds.
The decision to choose passive over active fund management, or vice versa, is not necessarily related to manager selection or manager value for money. It may be more related to personal preference or asset allocation.
But when the total cost and net performance data for a large selection of comparative active and passive equity funds collected from 69 different asset managers was plotted, it was easy to spot at least one reason why trustees might consider passive over active (see graph). 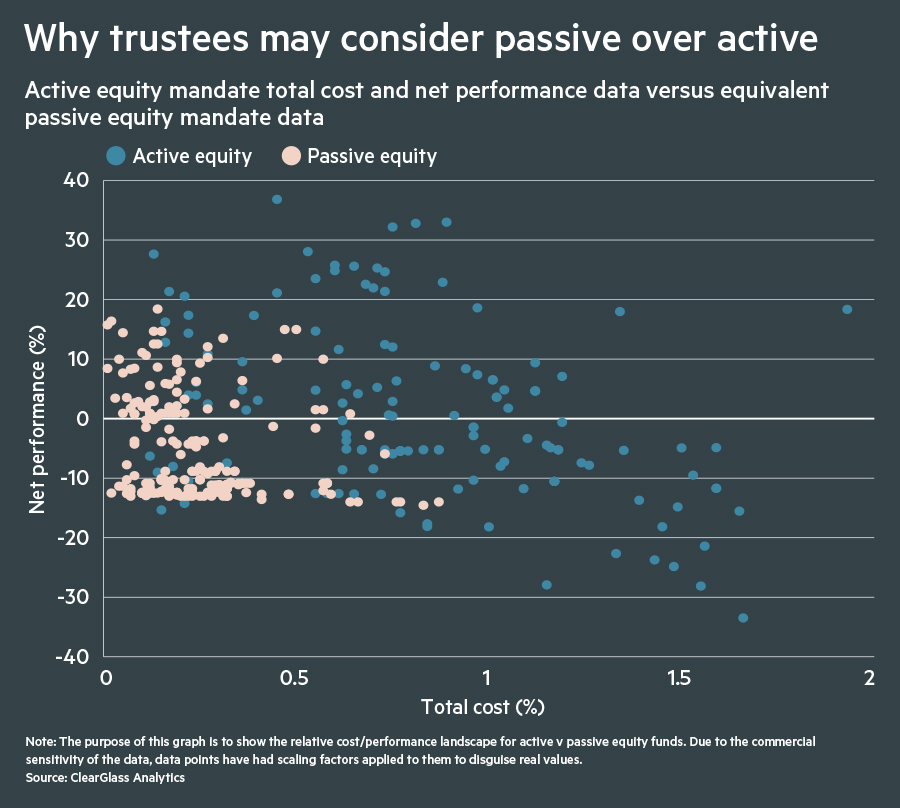
The data shows that passive funds tend to have a narrower range of likely performance outcomes for a narrower range of total costs.
Also, the highest levels of cost incurred by passive funds are relatively benign compared with active equivalents. Although the best returns for passive were not as good as those of active, the worst returns were considerably less painful.
To put it another way, if you want to limit your downside performance risk and not suffer the potential pain of also paying a high cost for bad performance, passive equity funds are the better choice.
But here is where it gets interesting. I took the top decile-performing active equity products, and then looked at all of the active equity products for the 11 managers that contributed to that data set, and did the same for the worst decile-performing active equity products – 10 fund managers (see table).
Mean net performance and mean total cost quartiles for all equity products of the best and worst-performing decile fund managers
|
Total cost |
Net performance |
||
|
Active equity |
Best decile managers |
Lowest cost (Q4) |
Second-best performance (Q2) |
|
Worst decile managers |
Highest cost (Q1) |
Worst performance (Q4) |
|
|
Passive equity |
Best decile managers |
Low cost (Q3) |
Poor performance (Q3) |
|
Worst decile managers |
High cost (Q2) |
Poor performance (Q3) |
Source: ClearGlass Analytics
The results are clear. The managers of the top-performing active products performed on average much better at a lower cost for all of their products than the managers of the bottom-performing products.
To be clear, the 11 managers that generated the highest performance of any active equity products also produced a wider range of products that, on average, returned top-quartile performance at near-lowest quartile costs.
And the 10 managers that generated the worst performance produced products that, on average, delivered bottom-quartile performance at top-quartile cost.
If trustees get their manager selection right for active equity fund management at least, they stand to gain a lot. But they can ill afford to get it wrong.
Interestingly, the same cannot be said for passive equity, where the difference between the best and worst-decile fund managers was less pronounced. Performance comparisons between passive products is perhaps less instructive, since this is largely dictated by the index they track.
Choosing the right manager
As to active versus passive, the best-performing active equity managers produced an outcome that on average had a total cost only 36 basis points more than that of the passive equity equivalents, while generating more than 8 percentage points better net performance.
Passive’s status as the cheap option is therefore not clear cut because, if you get the right active manager, you can get better performance for only a marginal increase in cost.
But this makes manager selection extremely important. Value assessments that include cost and performance data – preferably benchmarked – will be materially useful and help meet regulatory requirements.
Finally, some of the best value – from a cost and performance perspective – active and passive managers were also those most willing and able to give data.
At this early stage there appears to be a correlation between being willing and able to give data and other value-for-money factors.
This is not surprising, as culture surely must play a role. ‘Get the culture right and all else will follow’, is a hypothesis that needs to be tested, and is one for the professors to whom I have supplied my data.
Dr Chris Sier is chair of ClearGlass Analytics and led the FCA’s Institutional Disclosure Working Group